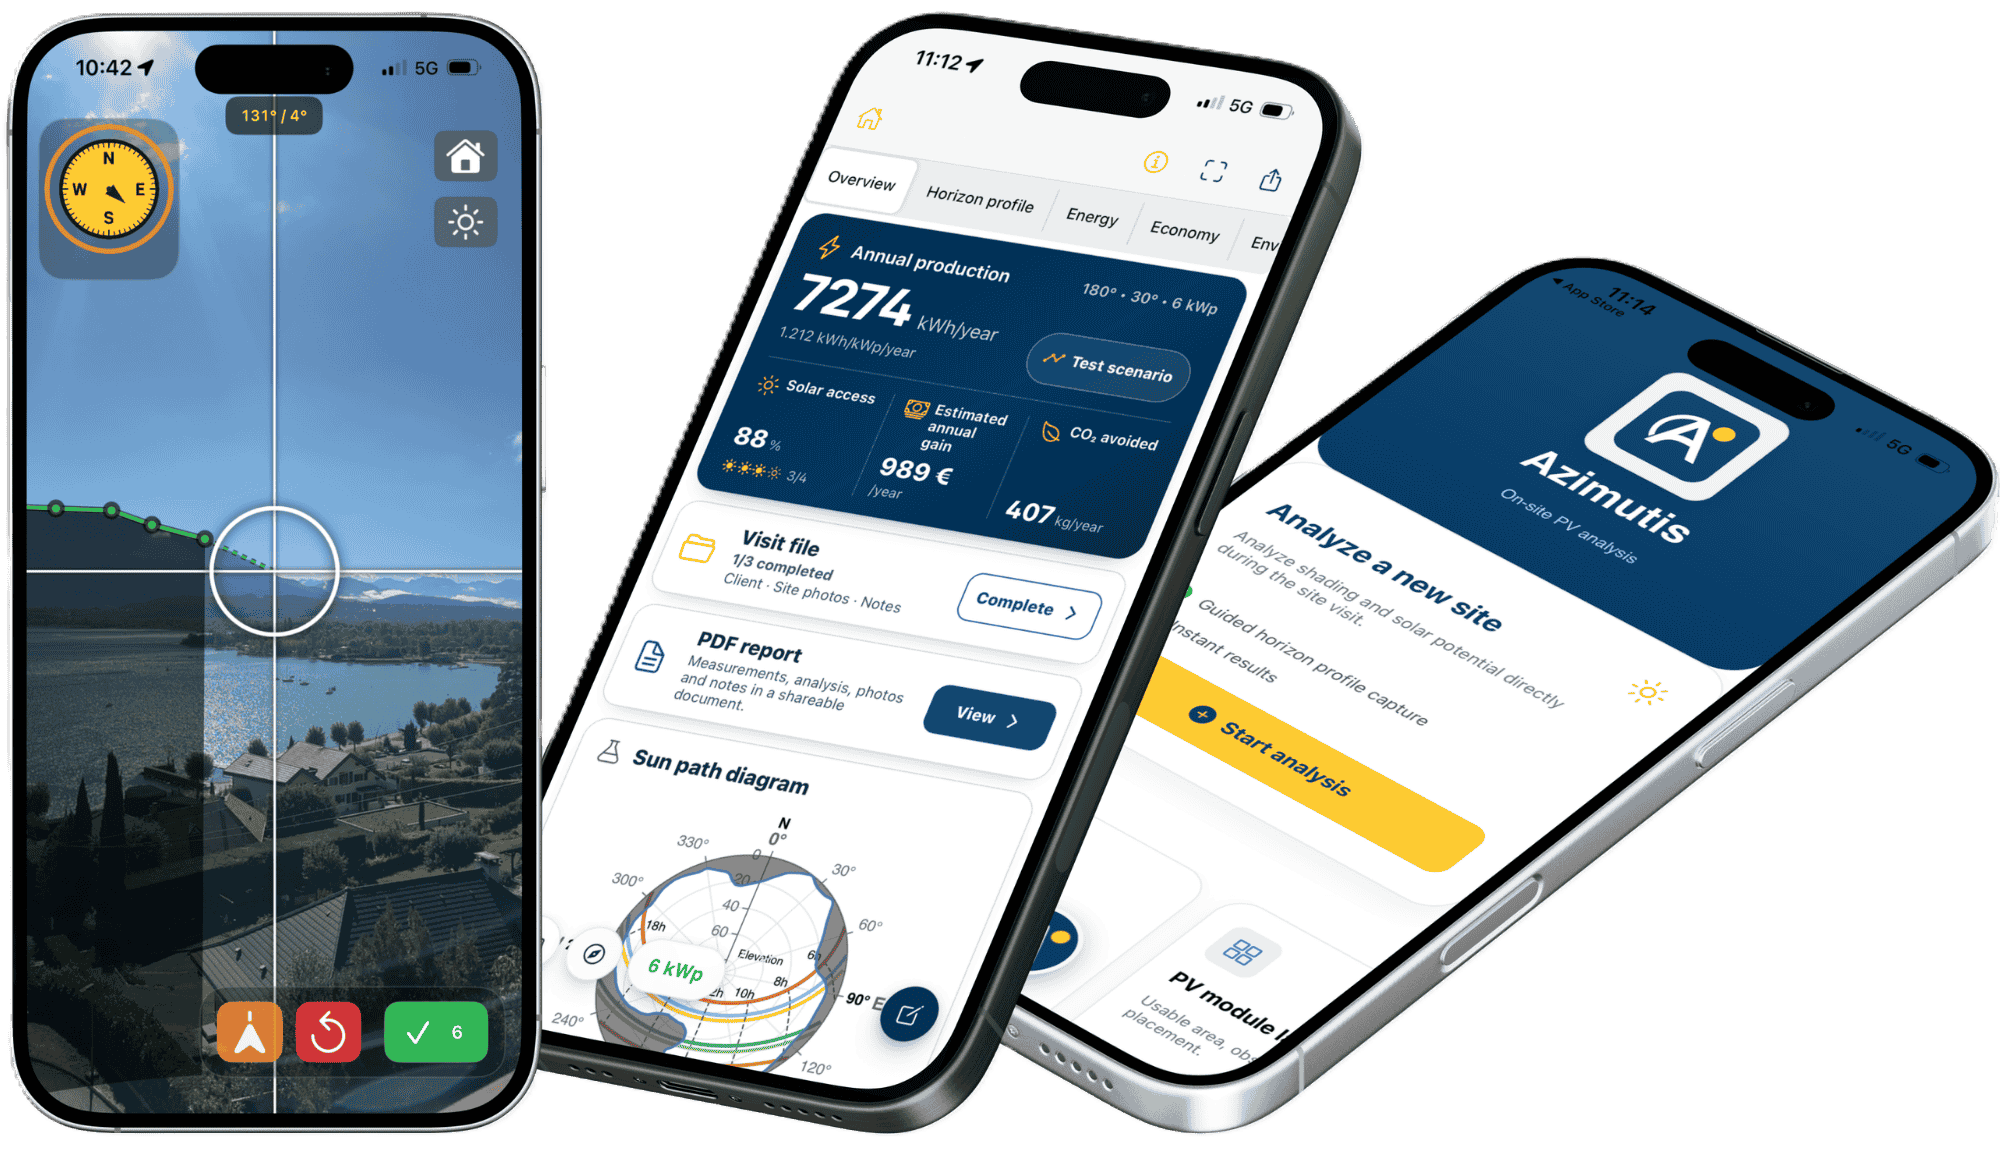
Capture actual site conditions and solar access before relying on design assumptions.
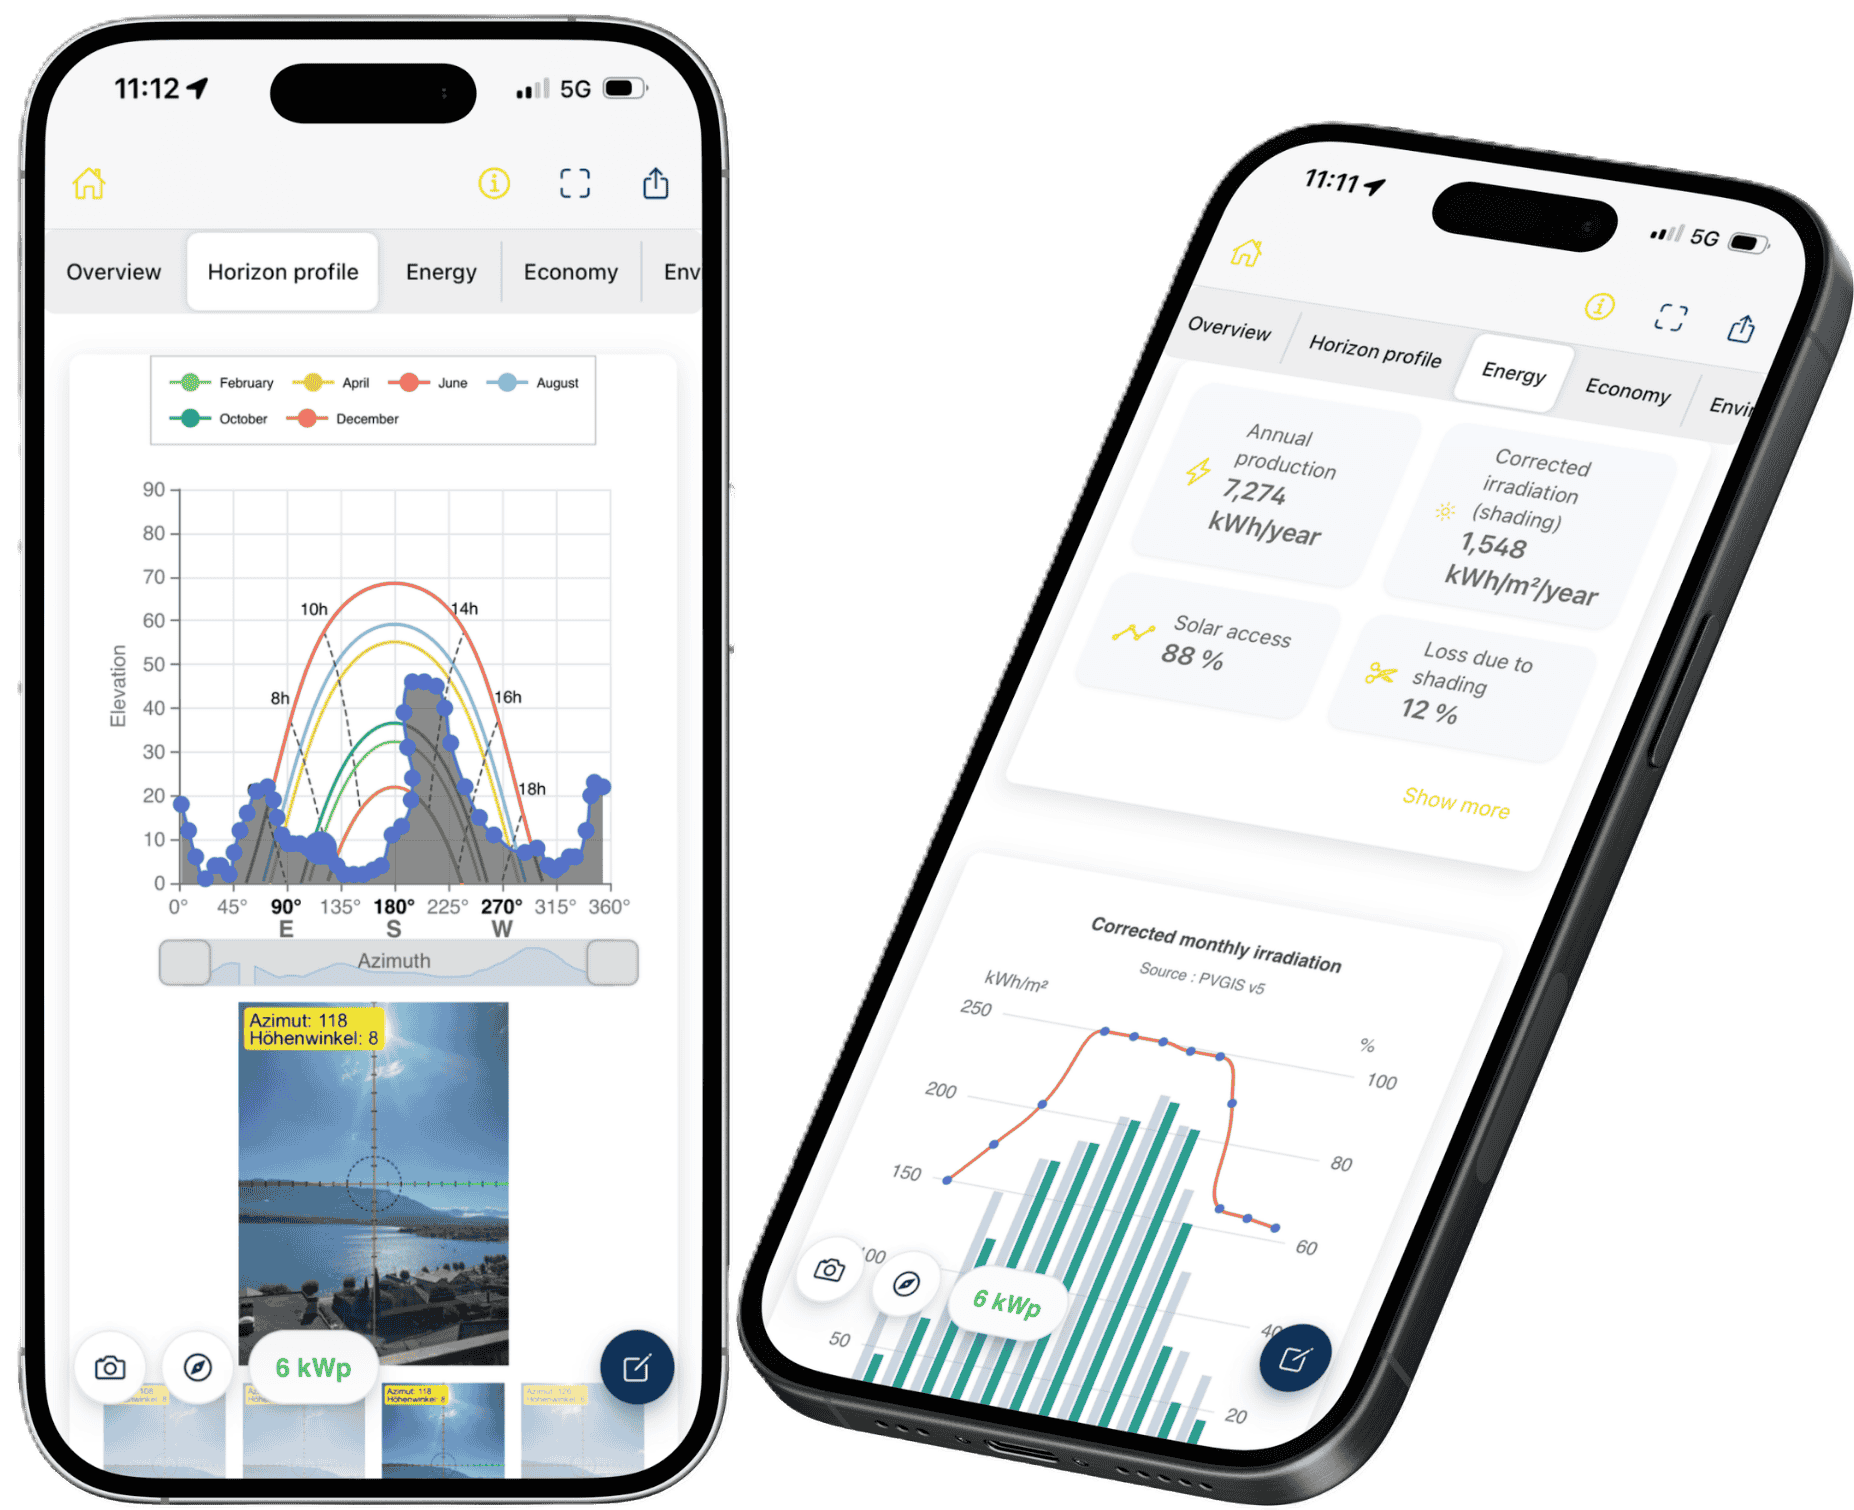
Shading analysis, horizon profile, sun path diagram, and near and far obstructions.
Measure the usable roof area, place modules and account for obstructions observed on site.
Determine the system size supported by the layout and compare multiple scenarios.
Estimated energy production, key indicators and a PDF report to support the decision.
Field data ready to show the customer and carry into your existing workflow and solar design tools.
Don't leave with only photos and notes. Use the site survey to verify the project, make decisions on site and reduce avoidable rework later.
Base project decisions on actual field measurements while you are still on site: realistic module layout, system size, shading and estimated production.
Identify what can actually be installed, the site constraints and the scenarios worth pursuing in design.
Catch shading, obstructions and site constraints early, before they trigger avoidable design revisions after the sale.
Site survey before proposal
Verify sales and design assumptions before the project moves forward.
Clear site (no shading)
Confirm usable roof area, module layout, system size and expected production.
Constrained or shaded site
Measure near and far obstructions, review the sun path diagram and identify constraints that may change the project.
Project documentation and design
Use PDF reports and technical exports to carry field data into project documentation and solar design software.
Azimutis is designed for the gap between sales assumptions and final design: the site survey, where actual site conditions are verified.
On site, you can capture shading and obstructions, measure usable roof area, test module layouts, determine the system size and estimate production from the conditions actually observed.
That gives you a concrete basis to confirm the key feasibility factors, discuss the project with the customer and reduce office rework or data re-entry.
No need to replace your sales or design software: Azimutis complements your workflow at the site survey stage.
Shading measurements captured with Azimutis do not rely only on raw data from the smartphone or tablet sensors.
The app combines built-in calibration tools, consistency checks and correction algorithms designed to improve the quality of azimuth and elevation measurements captured in the field.
Survey points can be reviewed and edited directly in the app.
Built-in calibration
Calibration tools help check measurement quality before and during the survey.
Consistency checks
Automatic checks verify the consistency of data captured in the field.
Correction algorithms
Processing designed to reduce certain sensor-related errors.
Manual adjustment
Captured points can be checked, corrected and refined directly in the app.
Azimutis turns the site survey into directly usable field data to assess the project on site, prepare project documentation and continue the design work in the tools you already use.
Outputs include:
The goal is field-to-design continuity: less data re-entry, measurements captured on site and a simple fit with your existing workflow.
Azimutis helps solar contractors, PV installers, engineering firms, architects, trainers and energy professionals verify project assumptions against actual site conditions during solar site surveys: shading, usable roof area, module layout, potential system size and expected production.
The app supports on-site shading analysis, generates horizon profile data that can be used in solar design software, and carries field data into the next project steps through PDF reports and technical exports.
No. Azimutis is a specialized field tool for solar site surveys and on-site assessment. It complements the software your company already uses by adding field data, feasibility results, a PDF report and technical exports for the next design steps.
Azimutis uses the device sensors to measure obstacle azimuth and elevation.
The app combines built-in calibration tools, consistency checks and correction algorithms designed to improve field measurement quality.
Survey points can be checked and adjusted directly in the app before export.
A solar shading analysis measures obstructions around a site to evaluate their impact on solar access.
The data can be used to estimate shading losses and assess project feasibility and expected PV production more accurately.
A horizon profile represents the obstructions visible from a given location.
It helps identify when the sun is blocked by buildings, trees or terrain and evaluate the impact on PV production.